Understanding Charge Curves in LiPo Batteries
In the world of portable power, the “Charge Curve” is more than just a line on a graph; it is the heartbeat of a Lithium Polymer (LiPo) battery. Whether you are an Original Equipment Manufacturer (OEM) designing a new medical device, a drone pilot optimizing flight turnover, or a robotics engineer, understanding the behavior of a battery during its charging cycle is critical for performance, longevity, and safety.
To the uninitiated, charging a battery seems simple: plug it in, wait for the light to turn green, and unplug. However, inside the cells, a complex electrochemical ballet is taking place. Ions are migrating, voltage potentials are shifting, and internal resistance is fighting against the flow of current. The visual representation of this process is the Charge Curve.
At Hanery, we live and breathe these curves. As a leading Chinese manufacturer specializing in polymer lithium batteries, 18650 packs, and Lithium Iron Phosphate (LiFePO4) solutions, our R&D labs generate thousands of these graphs daily. We analyze them to detect microscopic defects in electrode coating, verify electrolyte stability, and ensure that our custom packs meet the rigorous demands of our global clients.
This comprehensive guide will demystify the LiPo charge curve. We will move beyond the basic “0 to 100%” concept and dissect the physics of the Constant Current/Constant Voltage (CC/CV) profile, explain why the last 10% of charging takes so long, and teach you how to read a datasheet graph like a seasoned engineer.
Table of Contents
CC/CV Profile Listed: The Standard Algorithm
Almost every lithium-based battery, from the tiny cell in a Bluetooth earbud to the massive pack in an electric vehicle, follows the CC/CV (Constant Current / Constant Voltage) charging protocol. This is not a suggestion; it is a requirement dictated by the chemistry of lithium intercalation.
Phase 1: Constant Current (CC)
The process begins with the Constant Current phase. In this stage, the charger acts as a current source.
- The Action: The charger pushes a fixed amperage (e.g., 1C, or 1 Amp for a 1000mAh battery) into the battery.
- The Reaction: To force this current into the battery, the charger slowly raises its output voltage to overcome the battery’s internal voltage and resistance. On a graph, you see the current line stay flat (horizontal), while the voltage line climbs steadily and steeply.
- Energy Transfer: This is the “Bulk Charging” phase. Approximately 70% to 80% of the total energy is restored during this fast, aggressive stage.
Phase 2: Constant Voltage (CV)
Once the battery reaches its maximum safe voltage—typically 4.20V for standard LiPo or 4.35V for High-Voltage (LiHv) cells—the charger switches modes.
- The Action: The charger now acts as a voltage source. It clamps the voltage at exactly 4.20V.
- The Reaction: Because the voltage difference between the charger and the battery creates the flow of current, as the battery fills up and its internal voltage equalizes with the charger’s 4.20V, the current naturally drops. On a graph, the voltage line becomes flat (horizontal), and the current line curves downward exponentially toward zero.
- Saturation: This is the “Saturation” or “Topping Off” phase. It is slow, gentle, and responsible for packing the final 20% of capacity into the electrode structure.
Early-Stage Charging: The Pre-Charge Safety Check
Before the CC phase even begins, a smart charger performs a critical safety check known as “Pre-Charge” or “Trickle Charge.” This often appears as a small, short step at the very beginning of the graph, which many users overlook.
The Low-Voltage Danger
If a LiPo battery is over-discharged below 3.0V per cell, the internal chemistry becomes unstable. The copper anode current collector can begin to dissolve into the electrolyte. If you were to blast a deeply discharged cell (e.g., 2.5V) with full current immediately, it could cause an internal short circuit or massive heat generation.
The Conditioning Phase
- Threshold: If the charger detects voltage below ~3.0V.
- Action: It applies a very small current (usually 0.1C or roughly 10% of the main charge rate).
- Purpose: This gentle current “wakes up” the chemistry, reforming the passivation layer on the electrodes and slowly raising the voltage without thermal stress.
- Transition: Once the cell hits 3.0V, the charger switches to the full Constant Current (CC) phase described above. If a battery stays in this pre-charge phase for too long without rising in voltage, the charger will declare an error (Dead Cell).
Mid-Curve Behavior: The Linear Climb
The “Mid-Curve” refers to the steep voltage rise seen during the Constant Current phase. While it looks like a straight line, its slope tells a story about the battery’s quality and Internal Resistance (IR).
Ohm's Law in Action
The voltage you see on the charger screen is always higher than the actual chemical voltage inside the battery because the charger must overcome the battery’s internal resistance.
Steep vs. Shallow Slopes
- High Resistance (Old/Poor Quality): The voltage will shoot up very quickly. The charger hits the 4.2V ceiling prematurely. The battery isn’t actually full; it just has high resistance that is “tricking” the charger into switching to CV mode too early. The result is a battery that charges “fast” but has very little runtime.
- Low Resistance (Hanery Quality): The voltage rises slowly and steadily. The battery stays in the high-speed CC phase for a longer duration, absorbing more real energy before hitting the voltage limit. This indicates a healthy, high-performance cell.
Saturation Phase: Why the Last 10% Takes Forever
Users often complain that their device charges to 80% in 30 minutes, but takes another 30 minutes to reach 100%. This is not a flaw; it is the physics of the Saturation Phase (CV).
The Parking Lot Analogy
Imagine the battery anode is a parking lot and the lithium ions are cars.
- CC Phase (0-80%): The lot is empty. Cars can drive in at full speed (High Current) without hitting each other.
- CV Phase (80-100%): The lot is nearly full. New cars must drive slowly, looking for the few remaining empty spots. If they rushed in (High Current), they would crash (Lithium Plating).
Termination Current
How does the charger know when to stop? It cannot wait for the current to hit absolute zero, as that would take infinite time. Instead, it uses a Termination Current setting, typically 0.05C or 0.1C.
- Example: For a 2000mAh battery charged at 2A (1C), the charger will cut off when the current drops to 100mA (0.05C). This signals that the battery is “Full.”
Temperature Rise Pattern
Heat is the enemy of lithium batteries, but some heat generation is inevitable. The temperature profile of a charge cycle is not uniform.
The Exothermic Start and End
- tart of Charge: The battery is usually cool. As current rushes in, resistive heating ($I^2R$) causes a slight temperature rise.
- Middle of Charge: Lithium intercalation is actually slightly endothermic (heat-absorbing) in some chemistries, or neutral, so temperature stabilizes.
- End of Charge (Saturation): As the battery approaches full capacity, the internal chemical resistance to stuffing more ions into the anode increases. If the charger does not taper the current correctly, excess energy is converted into heat.
Hanery Engineering Note: A sharp rise in temperature near the end of the charge cycle is a warning sign. It often indicates that the battery is being overcharged or that the internal structure is degrading (high resistance). Smart chargers monitor this “Delta Peak” or absolute temperature cut-off (usually 45°C) to prevent thermal runaway.
Charging Efficiency: The Coulombic Reality
No battery is 100% efficient. If you put 1000mAh into a battery, you will not get 1000mAh out. However, LiPo batteries are remarkably efficient compared to older chemistries.
Coulombic Efficiency (CE)
This is the ratio of discharge capacity to charge capacity.
- Lead Acid: ~80-85% efficient (lots of energy lost as heat).
- NiMH: ~70-90% efficient.
- LiPo: 95% to 99% efficient.
Energy Efficiency vs. Charge Efficiency
While the charge efficiency (counting electrons) is high, the energy efficiency (Watt-hours) is slightly lower due to voltage difference. You charge at a higher voltage (avg ~4.0V) and discharge at a lower voltage (avg ~3.7V). The difference is lost as heat.
- Hanery Standard: We aim for an energy efficiency of >94% in our cell designs. A drop in charging efficiency is often the first metric we use to identify aging cells during cycle life testing.
Fast-Charging Influence
Modern consumers demand “Fast Charging” (PD, QC, VOOC). How does pumping 3C or 5C into a battery change the curve?
The Shrinking CC Phase
When you increase the charging current (e.g., from 1A to 3A), the voltage drop across the internal resistance triples.
- Result: The battery voltage hits the 4.2V ceiling much faster.
- Consequence: The efficient CC phase becomes shorter, and the slow CV phase becomes longer.
The False "Full"
Fast charging gets you to “80%” incredibly fast, but getting to a true “100%” takes nearly as long as a slow charge because the saturation physics cannot be cheated.
- Stepped Charging: To optimize this, Hanery engineers use Stepped Charging Algorithms. Instead of a simple CC/CV, we use multiple CC steps (e.g., 3C until 3.8V, then 2C until 4.0V, then 1C until 4.2V). This minimizes heat and prevents lithium plating while maximizing speed.
Why Curves Differ Among Brands
Not all 3.7V 2000mAh batteries generate the same curve. Why does a Hanery battery look different on a graph than a competitor’s generic cell?
Electrolyte Formulation
The ionic conductivity of the electrolyte determines the slope of the mid-curve. A higher conductivity electrolyte (used in high-discharge racing packs) allows for a flatter voltage curve and a longer CC phase.
Electrode Thickness
- High Energy Cells: Use thick electrodes to store more capacity. They have higher resistance, leading to steeper voltage curves and slower charging.
- High Power Cells: Use thin electrodes for speed. They have low resistance and can sustain high-current charging longer without hitting the voltage ceiling.
Manufacturing Quality
A curve with “noise” or jagged lines often indicates poor contact between the internal tabs and the electrode foil—a sign of cheap manufacturing. Hanery’s automated stacking process ensures smooth, consistent curves.
Charger Compatibility: Dumb vs. Smart
The quality of the charge curve is dictated by the charger as much as the battery.
"Dumb" Chargers (Brick Adapters)
Cheap USB chargers often have poor voltage regulation. They might ripple or fluctuate. If the voltage spikes above 4.25V, it degrades the battery. If it sags, it slows down charging.
"Smart" Chargers (Balance Chargers)
For multi-cell packs (e.g., 3S 11.1V), a smart charger monitors the curve of each individual cell.
- Balancing: If Cell A hits 4.2V while Cell B is at 4.1V, the charger bleeds power from Cell A to let Cell B catch up. This ensures the entire pack follows the ideal curve without any single cell becoming dangerous.
- The Hanery Advice: Always use a charger that matches the chemistry (LiPo vs LiFePO4) and cell count of your pack. Mismatching creates a curve that leads to fire.
How to Interpret Graphs: Reading the X and Y Axes
When looking at a battery datasheet or a smart charger screen, you are presented with two lines: Voltage (V) and Current (A) over Time (t).
The Voltage Line (Usually Rising)
- Steep Start: Recovering from discharge.
- Linear Middle: The bulk charge. If this is too steep, the battery has high resistance.
- Flat Top: The CV phase. The battery is holding at 4.2V.
The Current Line (Flat then Falling)
- Flat High Plateau: The CC phase. The charger is pumping max power.
- Exponential Drop: The CV phase. The battery is resisting further charge.
- The Drop-Off: When the current line drops to zero, the process is done.
The Capacity Line (Cumulative)
Some graphs plot mAh over time. This should be a steady, upward-sloping line that tapers off (flattens) as the current drops in the CV phase.
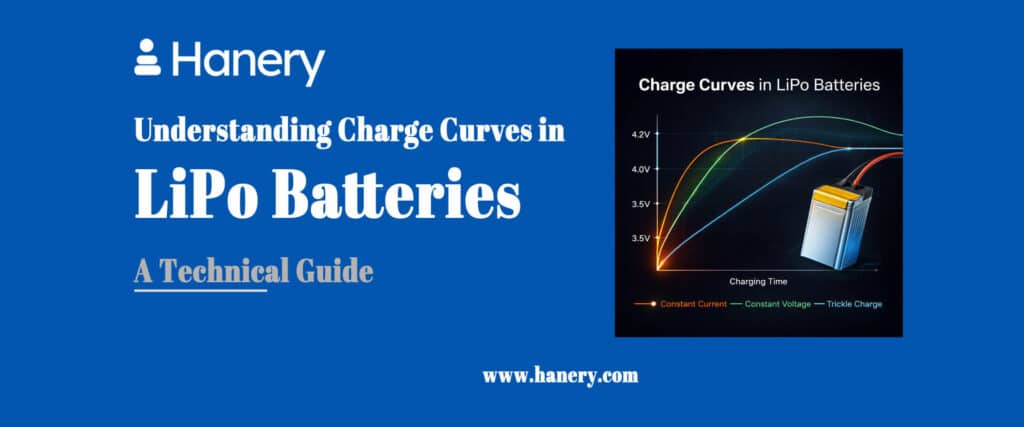
Chart: Visual Representation of LiPo Charge Phases
| Phase | Voltage Behavior | Current Behavior | Capacity Restored | Duration (Typical) |
|---|---|---|---|---|
| Pre-Charge | Rises from <3.0V to 3.0V | Constant Low (0.1C) | < 1% | 1-5 mins |
| Constant Current (CC) | Rises linearly to 4.2V | Constant High (1.0C) | ~70-80% | 40-60 mins |
| Constant Voltage (CV) | Holds steady at 4.2V | Drops exponentially | ~20-30% | 30-40 mins |
| Termination | Holds at 4.2V | Cuts to 0A at 0.05C | 100% | Instant |
Frequently Asked Questions
Can I interrupt the charge cycle before it finishes?
Yes. LiPo batteries have no “memory effect.” You can unplug them during the CC or CV phase without damaging the battery. In fact, stopping at 80% (end of CC phase) can actually double or triple the cycle life of the battery.
Why does my battery get warm after it is fully charged?
It shouldn’t. If the battery is warm after the charge is complete, it means the charger is continuing to “trickle charge” it, which is bad for LiPo chemistry, or the battery has a high self-discharge rate (internal short). Disconnect immediately.
What happens if the curve goes above 4.2V?
If the voltage curve exceeds 4.25V per cell, the electrolyte begins to oxidize and decompose. This generates gas (swelling) and heat. If it hits 4.5V, thermal runaway is likely.
Why is the “Fast Charge” curve so steep?
High current creates a large voltage drop across the internal resistance. The charger sees 4.2V “at the terminals” much sooner, even if the chemicals inside are only at 3.9V potential. This forces an early switch to the slower CV phase.
Can I use a NiMH charger on a LiPo battery?
Absolutely Not. NiMH chargers use a “Delta Peak” detection method (looking for a voltage drop) to terminate charge. LiPo voltage never drops at the end of a charge; it stays flat. A NiMH charger will pump current indefinitely until the LiPo catches fire.
What is “Lithium Plating” and how does it relate to the curve?
If you charge too fast (too high C-rate) or too cold, lithium ions pile up on the anode surface. This doesn’t show up instantly on the charge curve, but over time, it causes a permanent loss of capacity and creates dendrites that lead to short circuits.
Why does my old battery charge so fast?
An old battery has lost capacity. A 2000mAh battery that has degraded to 1000mAh will fill up twice as fast. It also has high resistance, hitting the 4.2V ceiling quickly. A fast charge time on an old battery is a sign of failure, not performance.
What is the ideal C-rate for the longest lifespan?
0.5C to 1C. Charging at 0.5C (e.g., 1A for a 2000mAh cell) keeps the battery cool and ensures the ions have time to intercalate properly, resulting in the flattest, most efficient charge curve.
Why does the voltage drop slightly when I unplug the charger?
This is “Relaxation.” During charging, the voltage is elevated to push current in. When you remove the current, the voltage settles back down to its natural chemical potential (Open Circuit Voltage). A drop from 4.20V to 4.18V is normal.
How does Hanery ensure curve consistency?
We use automated “Formation” grading. Every single cell produced is charged and discharged on a precision analyzer. We overlay these curves. Any cell that deviates from the “Golden Curve” by more than a tiny percentage is rejected as a defect.
Summary & Key Takeaways
The LiPo charge curve is the diagnostic X-ray of your battery’s health. It reveals the quality of the manufacturing, the impact of the charger, and the aging status of the cell.
- Respect the Phases: Understanding the transition from Constant Current to Constant Voltage explains why “fast charging” slows down at the end.
- Resistance Rules: The slope of the curve is a direct indicator of internal resistance. Steeper slopes mean less efficient charging and older batteries.
- Safety Limits: The 4.2V ceiling and temperature limits are non-negotiable boundaries defined by physics. Crossing them risks fire.
- Consistency is Quality: A high-quality battery from a reputable manufacturer like Hanery will exhibit a smooth, predictable curve every time, ensuring reliability for your device.
At Hanery, we engineer our batteries to deliver the most efficient charge curves possible, balancing speed with longevity. Whether you are an OEM looking for custom charging algorithms or a consumer wanting the best for your device, understanding these curves empowers you to make smarter energy decisions.
Optimize Your Charging Strategy
Are you an OEM struggling to optimize your device’s charging algorithm? Do you need a battery with a custom charge profile for specific applications?
Reach out for a consultation. Let us share our lab data and expertise to help you build a safer, faster, and more reliable power system.
Factory-Direct Pricing, Global Delivery
Get competitive rates on high-performance lithium batteries with comprehensive warehousing and logistics support tailored for your business.
Contact Info
- info@hanery.com
- +86 13414472012
- https://www.hanery.com/
- A15 Building, No.6 Xinfeng Road, Longcheng Street, Longgang District, Shenzhen, China